
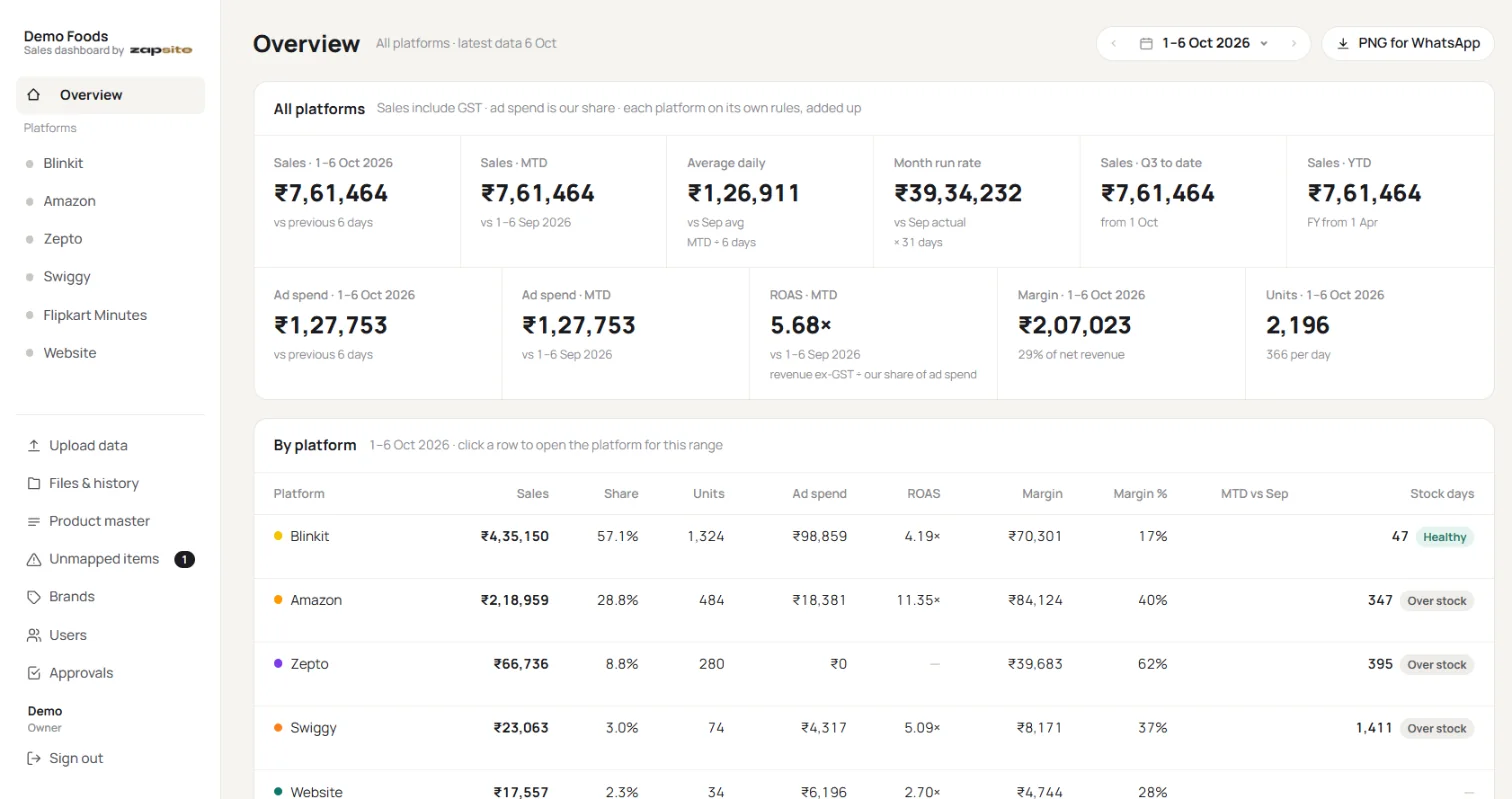
Know what you really earn on every quick-commerce order.
Blinkit, Zepto, Instamart, Amazon, Flipkart Minutes and your own website in one dashboard. Upload the reports you already download and see sales, ad spend, stock and true margin for every product.
Set up for you in a few days. No platform passwords needed.
Works with reports from
- Blinkit
- Zepto
- Swiggy Instamart
- Amazon
- Flipkart Minutes
- Your website
Stop guessing your margin from five different Excel files.
Each platform gives you its own reports in its own format. Most brands find out what they actually made weeks later, if at all.
Today
- Sales, ads and stock sit in separate downloads for each platform.
- Commission and ad spend are counted roughly, so margin is a guess.
- Products that lose money on ads keep running for weeks.
- Someone spends hours every week copying numbers into a sheet.
With Zapsite
- Drop in the reports and every platform shows up in one place.
- Margin after GST, commission, ads and COGS, product by product.
- See which products and campaigns earn, and which burn money.
- Your team sees the same numbers, each with the access they need.
Margin you can trust, down to the rupee.
For every order the dashboard takes off GST, the platform's commission, the ad spend for that product and your product cost. What's left is what you actually keep.
How product margin works- GST (5%)− ₹23.76
- Platform commission− ₹120.00
- Ads, per order− ₹96.00
- Product cost (COGS)− ₹150.00
- What you keep₹109.24
Illustrative numbers. The dashboard works this out for every product, every day, on every platform.
Every product, every platform.
Units, sales, ad spend, ROAS, margin and stock days for each product, grouped by brand and category. Loss-making products are marked in red.
See the product table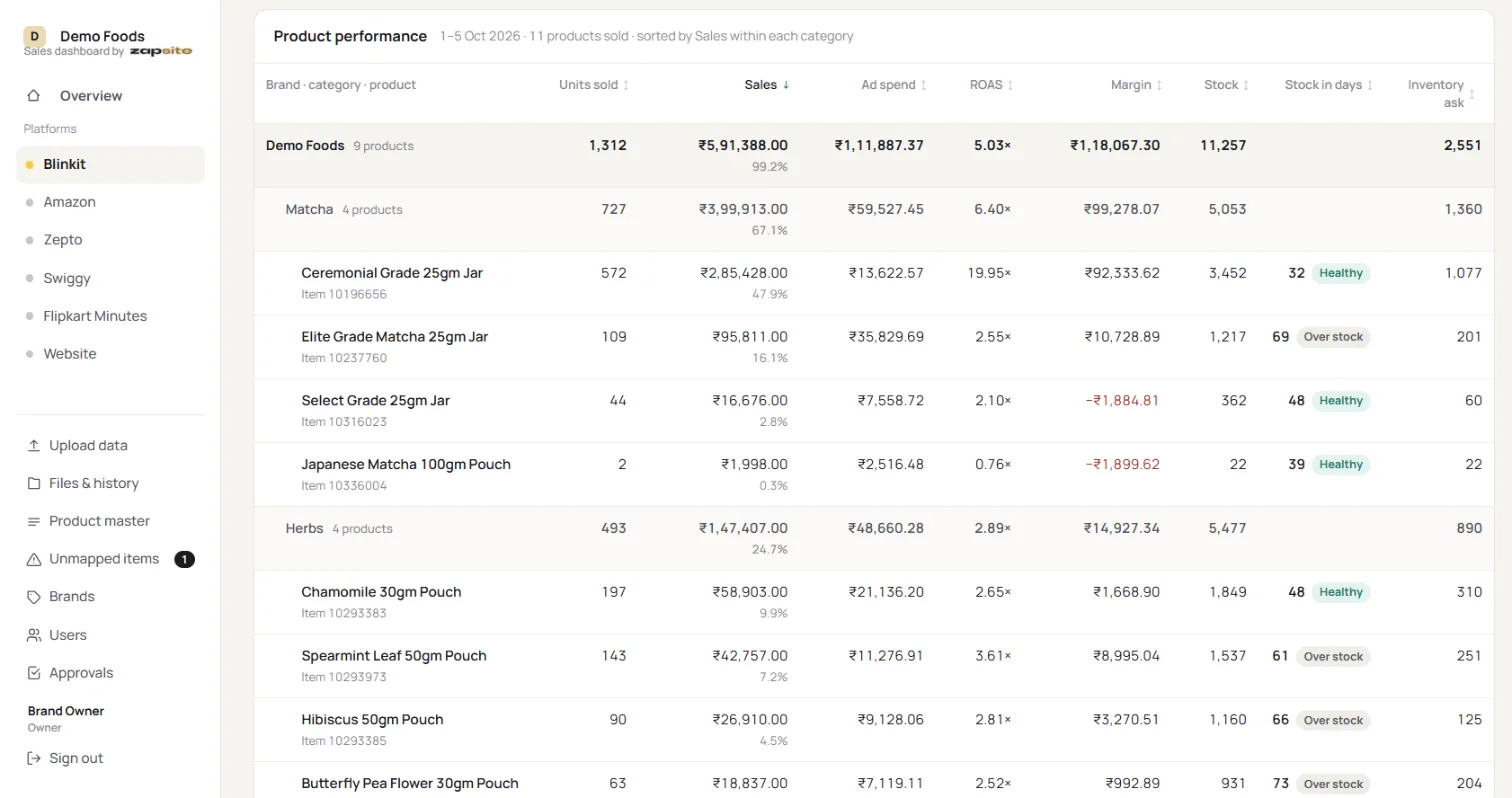
Upload once. Everything updates.
Drop in any report from any platform. The dashboard recognises it, and a calendar shows which days are uploaded and which are missing.
See uploading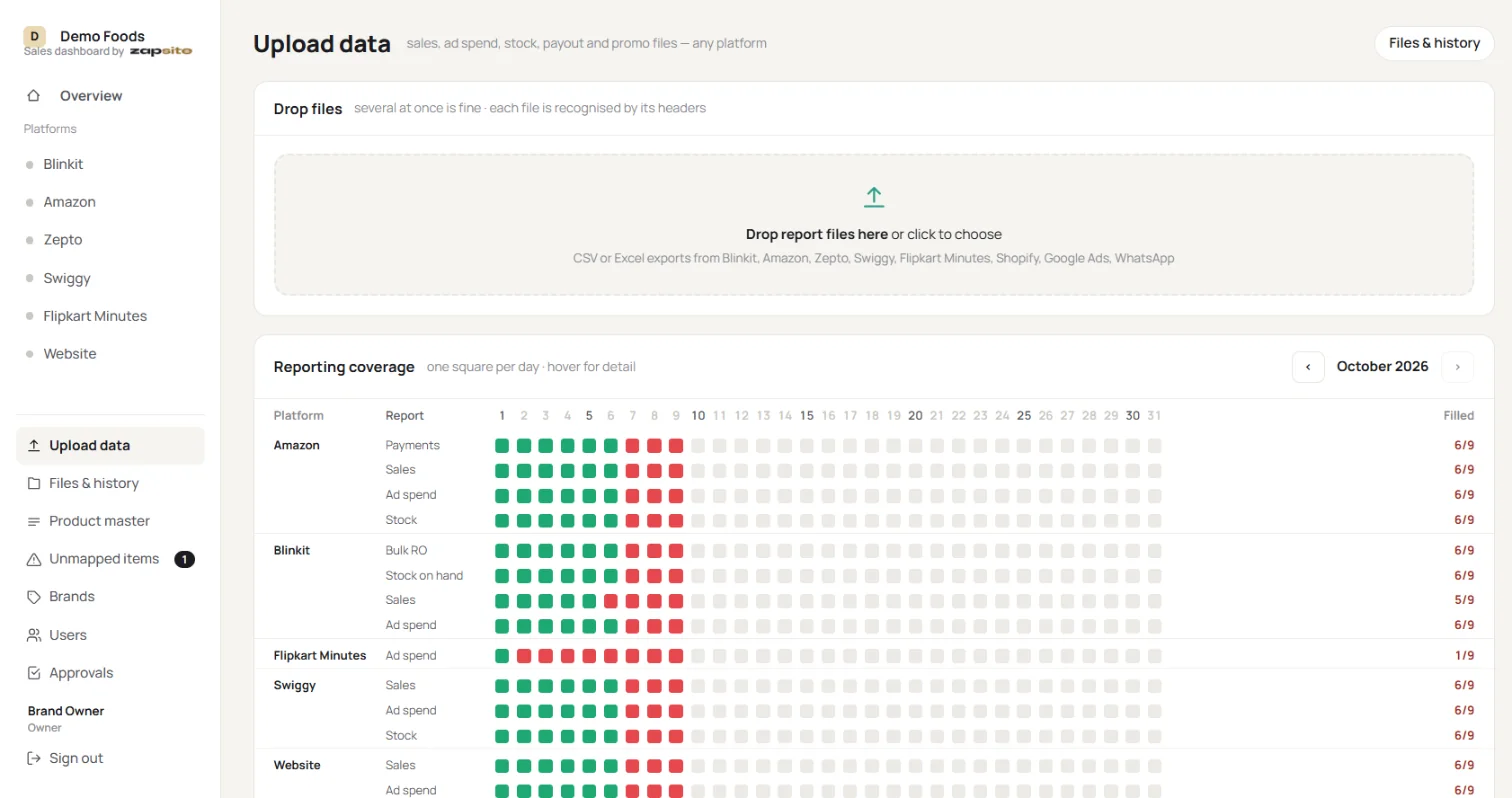
Live in a few days.
We do the setup. Your team only uploads reports.
We set you up
We add your products, costs and the IDs each platform uses for them, and create logins for your team.
You upload reports
Download the usual reports from each seller portal and drop them in. Daily or weekly, whatever suits you.
You see the numbers
Sales, ad spend, stock and margin update straight away, for every product and platform.
Simple monthly plans.
Every plan includes the full dashboard. Compare plans in detail.
Lite
One brand on one platform.
- 1 brand
- 1 platform
- 1 user
- Margin, ads and stock reports
- WhatsApp support
Starter
A growing brand on two platforms.
- 1 brand
- 2 platforms
- 2 users
- Margin, ads and stock reports
- WhatsApp support
Growth
Several brands across every platform.
- 5 brands
- All platforms
- 5 users
- Margin, ads and stock reports
- WhatsApp support
Pro
Big catalogues and bigger teams.
- Unlimited brands
- All platforms
- 10 users
- Margin, ads and stock reports
- WhatsApp support
One-time onboarding fee of ₹1,999 covers setup and mapping your products. Need something different? Ask for a custom plan.
See it with your own numbers.
Book a 20-minute demo. Bring last week's reports and we'll show you your margin by product.